Bitcoin Support and Resistance Levels
Bitcoin Support and resistance levels can help traders gain extra insight into the strength of bitcoin price trend.
What is support and resistance?
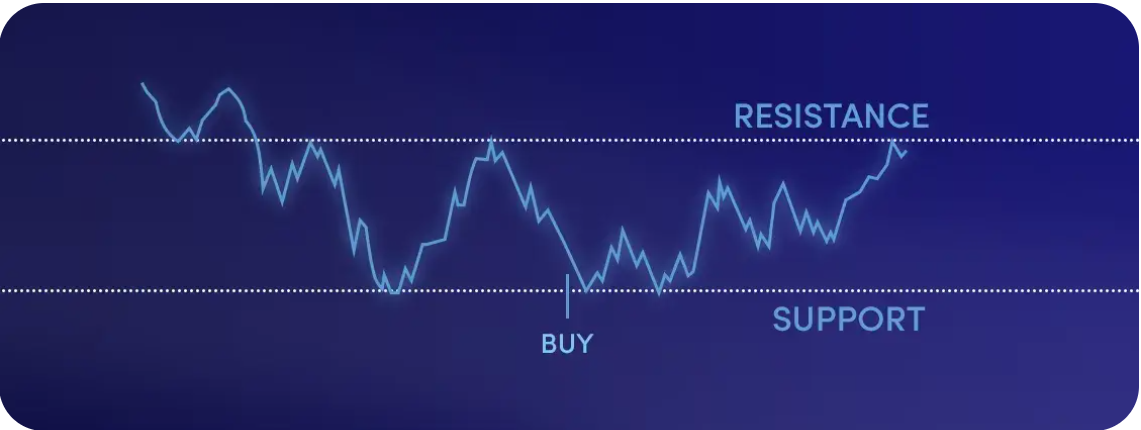
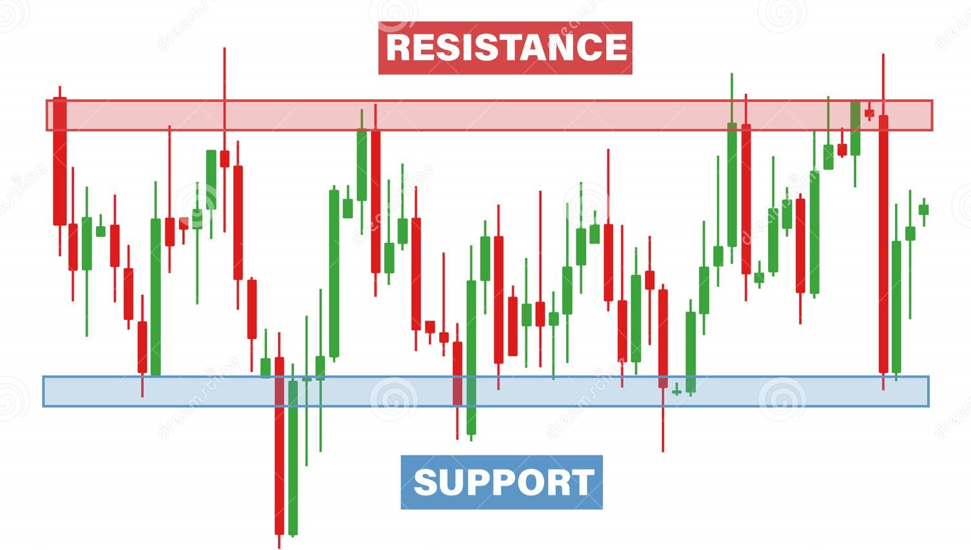
Support and resistance refer to two key levels on a Bitcoin price chart that appear to limit the market's movement. The support level is where Bitcoin's price typically stops falling and rebounds, while the resistance level is where the price usually stops rising and pulls back. These levels are driven by supply and demand—when buyers outnumber sellers, the price tends to rise; when sellers outnumber buyers, the price typically falls.

The more frequently Bitcoin's price tests a support or resistance level, the more reliable that level becomes in predicting future price movements. These levels often act as psychological barriers for traders, prompting buying or selling when a level is reached, which reinforces the effect.
If Bitcoin's price touches or briefly breaks through a support or resistance level but quickly reverses, it's considered a test of that level. However, if the price breaks through and sustains for a longer period, it's likely to continue moving in that direction until a new support or resistance level is established.
How to identify support and resistance level
There are several ways to identify support and resistance levels, which are essential for determining the best times to enter the market and where to set stops and limits. To identify these levels, traders can consider:
Historical price data
Previous support and resistance levels
Technical indicators
Historical prices are the most reliable source for identifying support and resistance levels, making them invaluable to traders. Familiarizing yourself with past patterns, even from recent activity, helps you recognize them if they reappear. However, it's important to remember that past patterns may have formed under different circumstances, so they aren't always a dependable indicator.
Previous notable support or resistance levels can serve as markers for potential entry and exit points, as well as indicators of future price movement. Keep in mind that major support and resistance levels are rarely exact numbers. Markets typically don't reverse at precisely the same price each time, so it's more helpful to view them as support or resistance zones.
Technical indicators or trendlines, like those discussed later in this article, can offer dynamic support or resistance levels that shift as the chart progresses. Different markets often have support and resistance levels influenced by various factors, so developing the skill to recognize which levels will impact a market's price can take time. Therefore, it's crucial to practice identifying these levels using historical charts.
How to draw Support and Resistance lines
There are a few things to keep in mind when drawing Support and Resistance lines.
First, you want to make sure that the lines are horizontal. This will help you to easily see the price action and identify potential reversals.
Second, you want to make sure that the lines are drawn at key levels. This means identifying areas where the price has reversed in the past or where there is a significant level of Support or Resistance.
Finally, you want to make sure that the lines are spaced evenly. This will help you to more easily identify potential breakouts or trend reversals.
