Bitcoin Prediction 2024 July 29th
BTC Price: $69,547.78
UTC Time: 5:03 PM
Market Sentiment
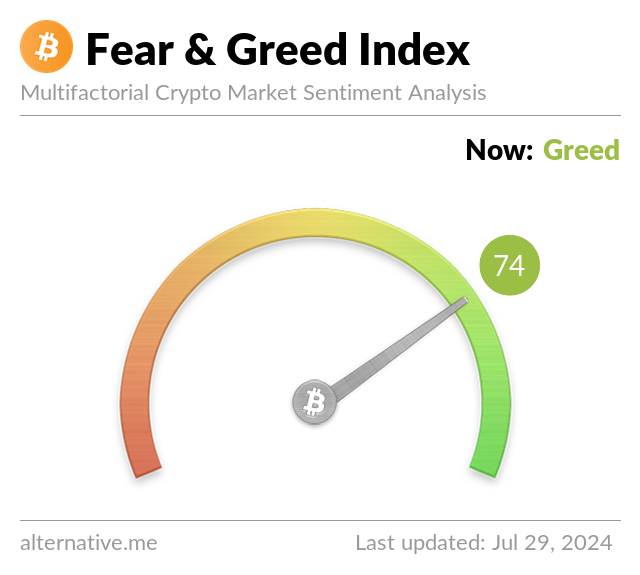
Fear and Greed Index: 74 (Greed).
24-Hour Trading Volume: $23.38 billion

Technical Indicators
Relative Strength Index (RSI) :
60 (Slightly overbought)
Moving Averages:
50-day MA: $66,500 (BTC trading above this level, indicating a bullish trend)
200-day MA: $64,300 (BTC trading above this level, confirming long-term bullishness)
Key Support and Resistance Levels
Support: $66,650, $63,460
Resistance: $70,900, $72,000
On-Chain Metrics
Active Addresses: 980,000 (Steady growth indicating strong network activity)
Hash Rate: 180 EH/s (Near all-time highs, showing robust network security)
Predicted Trend for Today

Given Bitcoin's current performance and market conditions, here are the potential scenarios for today:
- Bullish Scenario:
Sustained momentum above $70,000.
Continued positive regulatory news and institutional investments.
Increased trading volume.
Target: If BTC holds above $70,000, it could aim for $72,000 and potentially move higher towards $75,000.
- Bearish Scenario:
Failure to maintain momentum above $70,000.
Negative regulatory news or macroeconomic factors.
Decrease in trading volume.
Target: If BTC fails to hold above $70,000, it might test support levels at $66,000 and $64,000. A drop below $64,000 could see BTC testing the $62,000 level.
- Sideways Scenario:
Mixed news and sentiments without clear bullish or bearish triggers.
Consolidation around the current price levels.
Target: BTC could trade sideways between $68,000 and $70,000, consolidating before making a significant move.
Summary
Bitcoin is showing strength after recently breaking through the $69,000 level, trading above key moving averages and with solid on-chain metrics. The overall sentiment is positive with potential for further gains if it maintains momentum above $70,000.
Investment Plan:
Bitcoin Short Selling:
Around $69,900
Stop Loss:
Around $70,400
Take Profit:
Around $68,200
Weekly closing with a bullish cross star, with a slight advantage for bulls, but caution is needed for high-level cross stars, as there is a certain probability of inertial price increases in the short term. Due to the large slope of overall price increases, in general, except for strong unilateral bull markets where such situations occur, it is necessary to be alert to the possibility of a pullback trend where the opposite is true in other periods where the slope is too large. In the 4H chart, the price maintains an upward trend, and the reference line shows that the upper pressure mainly lies at the positions of 70000 and 72000. Although the recent bullish performance has been impressive, the high pressure still needs to be respected. In addition, from the perspective of profit and loss ratio and space, currently adopting a reverse thinking approach to short selling on the left side is more cost-effective than going long or chasing long at high positions.
Disclaimer: The opinions expressed are for informational purposes only and should not be construed as investment advice. Please do your own research before making any investment decisions.
