Bitcoin Prediction 2024 July 31th
BTC Price: $66,166.54
UTC Time: 12:00 AM
Market Sentiment Today
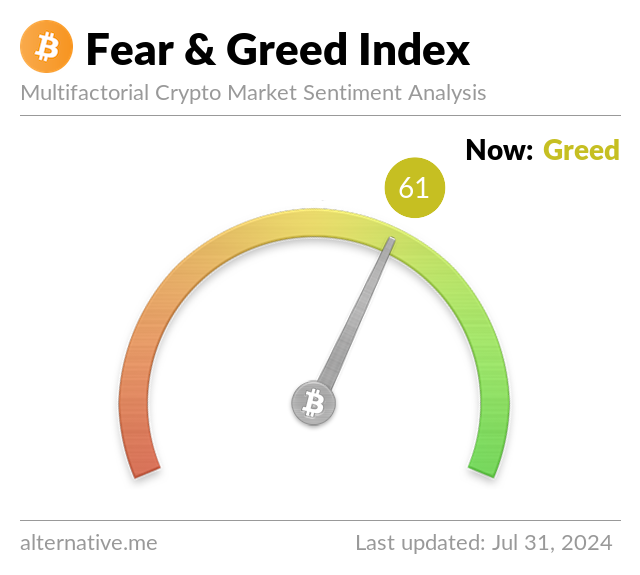
Fear and Greed Index: 61 (Greed)
24-Hour Trading Volume: $28.93 billion

Technical Indicators
Relative Strength Index (RSI) :
48 (Neutral)
Moving Averages:
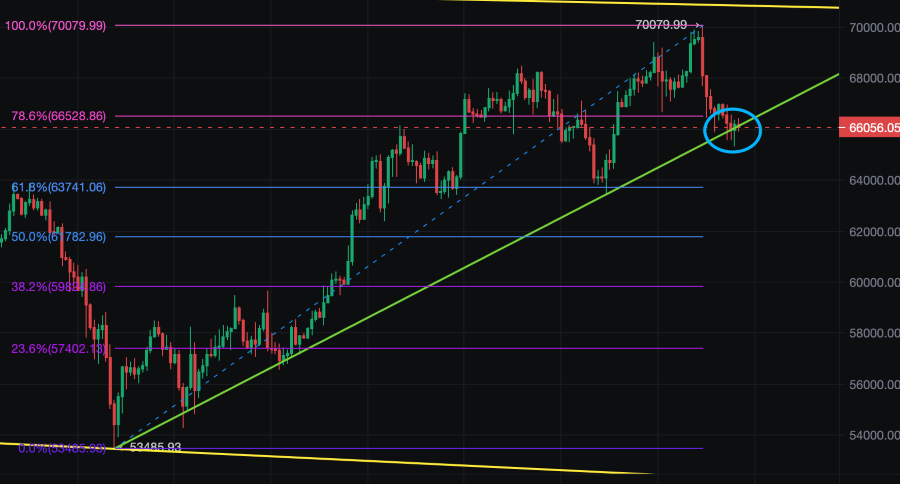
50-day MA: $66,500 (BTC trading below this level, indicating potential resistance)
200-day MA: $64,000 (BTC trading above this level, confirming long-term bullishness)
Key Support and Resistance Levels
Support: $64,000, $62,000
Resistance: $66,500, $68,000
On-Chain Metrics
Active Addresses: 980,000
Hash Rate: 190 EH/s
Predicted Trend for Today

Given the current market sentiment and technical indicators:
- Potential Upside:
If BTC can break above the 50-day moving average at $66,500, it may test the next resistance level around $68,000.
- Potential Downside:
If BTC fails to hold the current price level, it could drop to test the support levels at $64,000 or $62,000.
Conclusion
The overall sentiment remains neutral. Traders should watch for a breakout above $66,500 for a potential upward move or prepare for a pullback to support levels if resistance holds.
Investment Plan
Bitcoin Short Selling:
Around $66,166
Stop Loss:
$66,900
Take profit:
Around $64,400
Disclaimer: The opinions expressed are for informational purposes only and should not be construed as investment advice. Please do your own research before making any investment decisions.
