Bitcoin Prediction 2024 Augest 12th
BTC Price:
$58,668
UTC Time: 7:52 AM
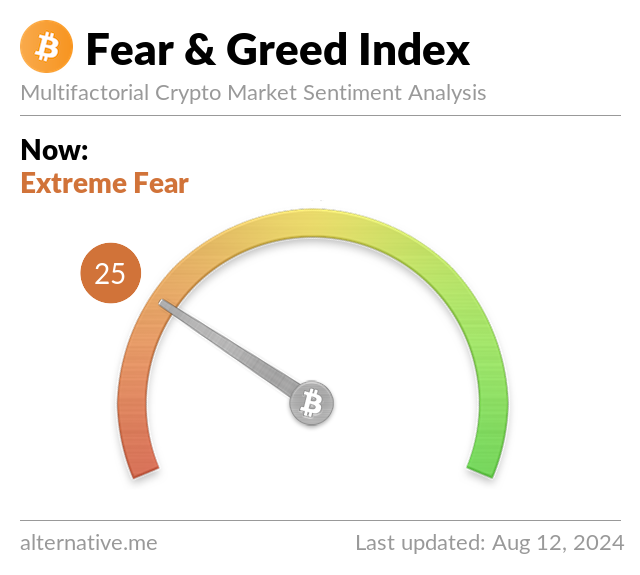
Market Sentiment Today
Fear and Greed Index: 25 (Extreme Fear)

Bitcoin Technical Analysis
Bitcoin Relative Strength Index : 45
Measures the speed and change of bitcoin price movements. Values range from 0 to 100. Typically, RSI above 70 indicates overbought conditions, while RSI below 30 indicates oversold conditions.
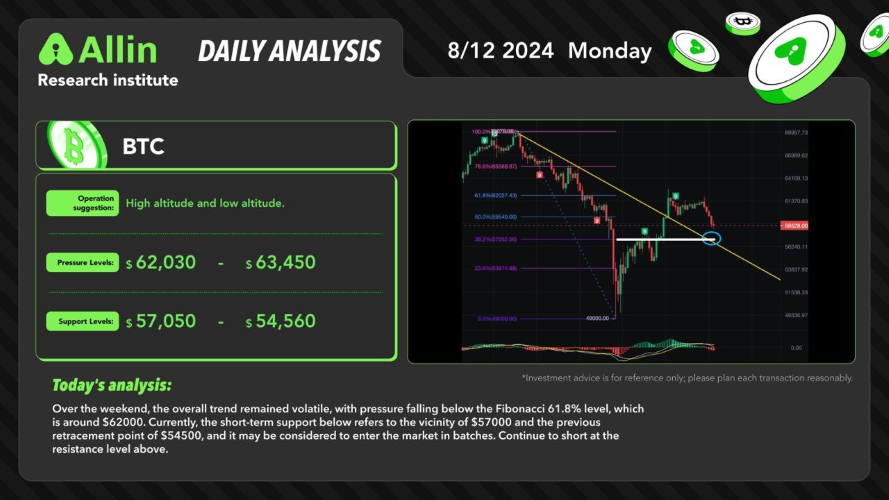
Bitcoin Support and Resistance Levels
Bitcoin Support and resistance are terms for two respective levels on a price chart that appear to limit the market's range of movement. The Bitcoin support level is where the price regularly stops falling and bounces back up, while the Bitcoin resistance level is where the price normally stops rising and dips back down. The levels exist as a product of supply and demand if there are more buyers than sellers, the price could rise, and if there are more sellers than buyers, the price tends to fall.
Bitcoin Support Level
Daily Chart: $57,050
Bitcoin Resistance Level
Daily Chart: $62,030
Bitcoin Prediction 2024 August 12th Summary
Given the Bitcoin Sentiment Analysis and Bitcoin Technical Analysis Indicators
Potential Upside:
If BTC can break above price at $59,000. it may test the resistance level around $60,000
Potential Downside:
If BTC fails to hold the $59,000 it could drop to test the support levels at $57,050
Investment Plan:
Bitcoin Short Selling:
Around $58,700
Stop Loss:
Around $59,500
Take profit:
Around $57,000
Disclaimer: The opinions expressed are for informational purposes only and should not be construed as investment advice. Please do your own research before making any investment decisions.
