Bitcoin Prediction 2024 August 19th
BTC Price:
$58,582
UTC Time: 7:07 AM
Bitcoin Sentiment Analysis
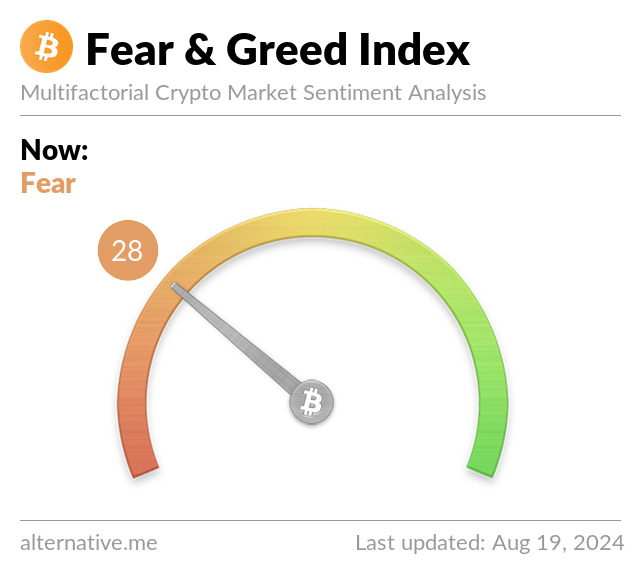
Fear and Greed Index: 28 (Fear)
The behavior of the Bitcoin market is heavily influenced by emotions. When the market is on the rise, people often become overly greedy, leading to FOMO (Fear of Missing Out). On the other hand, when prices drop, many investors tend to panic and sell off their assets impulsively. Our Fear and Greed Index is designed to help you avoid these emotional pitfalls. The concept is straightforward:
Extreme fear might indicate that investors are overly anxious, which could present a buying opportunity.
Conversely, excessive greed may signal that the market is poised for a correction.

BTC Volatility Index: 57.90
The BTC Volatility Index (BVIN) is a metric that measures the volatility or price fluctuations of Bitcoin. It serves several key purposes:
-
Risk Assessment: BVIN helps investors gauge the risk level of the Bitcoin market. Higher volatility indicates greater uncertainty and potential price swings, while lower volatility suggests a more stable market.
-
Investment Decisions: Investors may use the BVIN to adjust their strategies. For instance, they might reduce exposure or seek hedging options during high volatility, or increase investments when volatility is low.
-
Options Pricing: For those involved in the Bitcoin options market, BVIN is crucial since volatility is a key factor in pricing options. Higher volatility often leads to higher option prices.
-
Market Sentiment: The BVIN can also reflect market sentiment. High volatility typically signals fear or uncertainty, while low volatility suggests a calmer market.
In summary, the BTC Volatility Index is a vital tool for understanding and navigating Bitcoin market fluctuations.
Bitcoin Technical Analysis
Bitcoin Relative Strength Index : 45.21
Measures the speed and change of bitcoin price movements. Values range from 0 to 100. Typically, RSI above 70 indicates overbought conditions, while RSI below 30 indicates oversold conditions.
Bitcoin Support and Resistance Levels
Bitcoin Support and resistance are terms for two respective levels on a price chart that appear to limit the market's range of movement. The Bitcoin support level is where the price regularly stops falling and bounces back up, while the Bitcoin resistance level is where the price normally stops rising and dips back down. The levels exist as a product of supply and demand if there are more buyers than sellers, the price could rise, and if there are more sellers than buyers, the price tends to fall.
Bitcoin Support Level
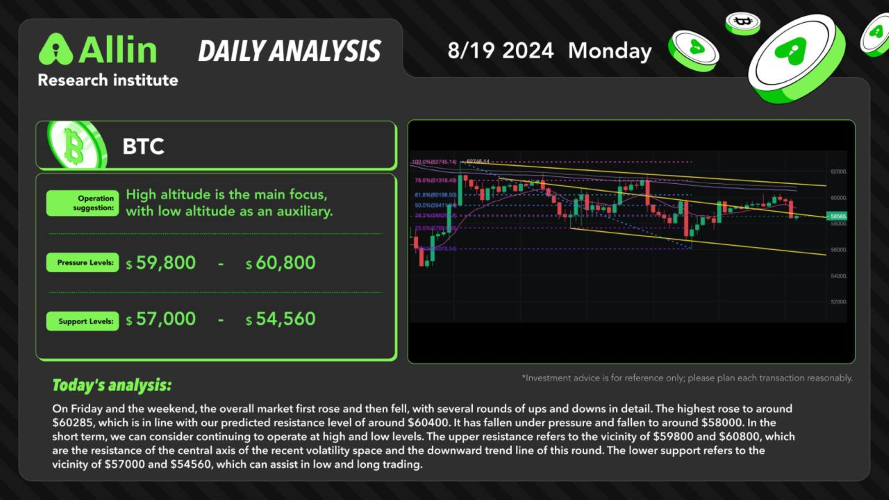
Daily Chart: $57,000
Bitcoin Resistance Level
Daily Chart: $59,800
Bitcoin Prediction 2024 August 19th Summary
Based on Bitcoin sentiment analysis and technical indicators,Bullish momentum is insufficient. we made the following shorting plan.Please manage your position size and leverage carefully.
Investment Plan:
Bitcoin Short Selling:
Around $58,582 - $58,700
Stop Loss:
Around $59,710
Take Profit:
Around $57,000 - $56,000
Disclaimer: The opinions expressed are for informational purposes only and should not be construed as investment advice. Please do your own research before making any investment decisions.
