Price Chars
A price chart is a graphical representation of an asset's price movements over a specified period. In the context of trading and investing, price charts are used to visualize how the price of an asset, like Bitcoin, has changed over time. These charts are fundamental tools in technical analysis, allowing traders to analyze past price behavior, identify trends, patterns, and potential price movements.
Types of Price Charts
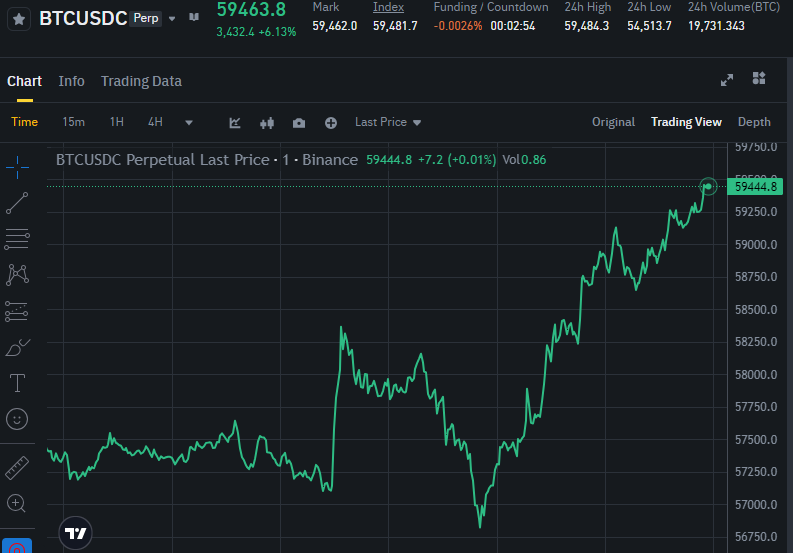
Line Chart

A line chart connects the closing prices of an asset over a specified time period with a continuous line.
It is simple and provides a clear view of the overall direction of the price. However, it does not show the full range of price movement within each period (like highs and lows).
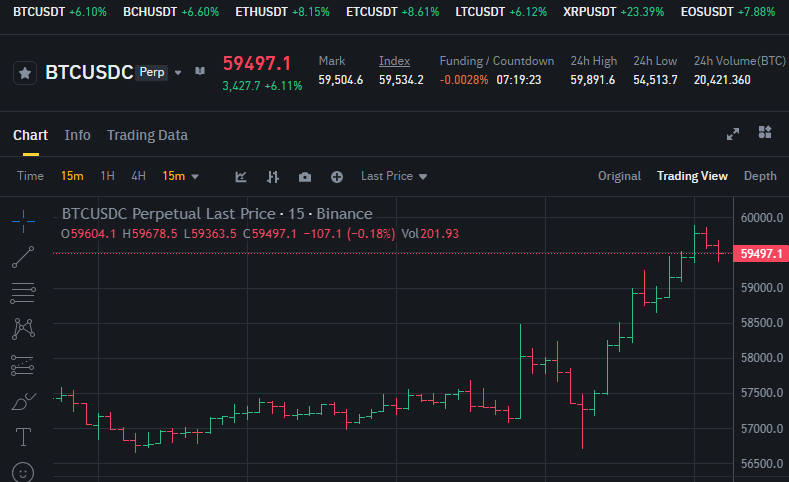
Bar Chart

A bar chart provides more detailed information, showing the opening, high, low, and closing prices for each time period. Each bar represents one period (e.g., one day).
Bar charts are used to analyze the price range within each period, helping traders see how the price moved from the opening to the closing of the market and how volatile the asset was during that period.
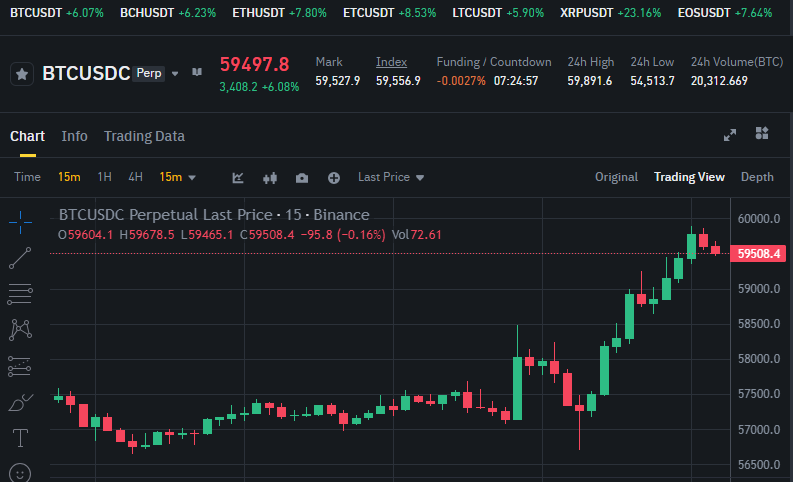
Candlestick Chart

A candlestick chart is similar to a bar chart but more visually informative. Each "candle" represents the price movement over a specific time period, showing the opening, closing, high, and low prices. The body of the candle shows the difference between the opening and closing prices, while the wicks (or shadows) show the high and low prices.
Identifying specific trading patterns and making quick visual assessments of market sentiment.
Price Charts function
Identify Trends
Uptrend
A series of higher highs and higher lows, indicating that the price is generally increasing.
Downtrend
A series of lower highs and lower lows, indicating that the price is generally decreasing.
Sideways Trend
The price is moving within a horizontal range, indicating no clear direction.
Spotting Support and Resistance Levels
Support
A price level where a downtrend may pause due to buying interest. It's like a "floor" that the price struggles to go below.
Resistance
A price level where an uptrend may pause due to selling interest. It's like a "ceiling" that the price struggles to rise above.
Use Technical Indicators
Moving Averages
Used to smooth out price data to identify the direction of the trend. For example, a 50-day moving average line on a chart can show the average price over the last 50 days, helping to identify the trend.
Relative Strength Index (RSI)
Helps identify overbought or oversold conditions in the market. An RSI above 70 might indicate an overbought market, while below 30 might indicate an oversold market.
Analyze Chart Patterns
Head and Shoulders
A reversal pattern that indicates a trend change from bullish to bearish.
Double Top and Double Bottom
Patterns that indicate potential reversals. A double top suggests a bearish reversal, while a double bottom suggests a bullish reversal.
Triangles
Patterns that indicate a continuation of the current trend. For example, an ascending triangle is often a bullish continuation pattern.
Volume Analysis
Confirming Trends
Volume bars under the price chart show the number of trades during a specific period. High volume during price increases or decreases can confirm the strength of the trend.
Set Entry and Exit Points
Buying
Look for entry points at support levels or after bullish patterns.
Selling
Look for exit points at resistance levels or after bearish patterns.
Practical Example
If you're analyzing Bitcoin using a candlestick chart
Identify the trend
Is Bitcoin in an uptrend, downtrend, or moving sideways?
Look for support and resistance levels
Identify price levels where Bitcoin has previously struggled to break through.
Use indicators
Apply moving averages to see the trend direction or RSI to check if Bitcoin is overbought or oversold.
Spot patterns
Look for patterns like a head and shoulders or a triangle that might indicate a future price movement.
Analyze volume
Check the volume to see if there is strong buying or selling interest, confirming the trend or pattern you’ve identified.
By mastering these elements, you can use price charts to make more informed trading decisions.
